

Images and Videos of Canvas Course Analytics
About this Tool
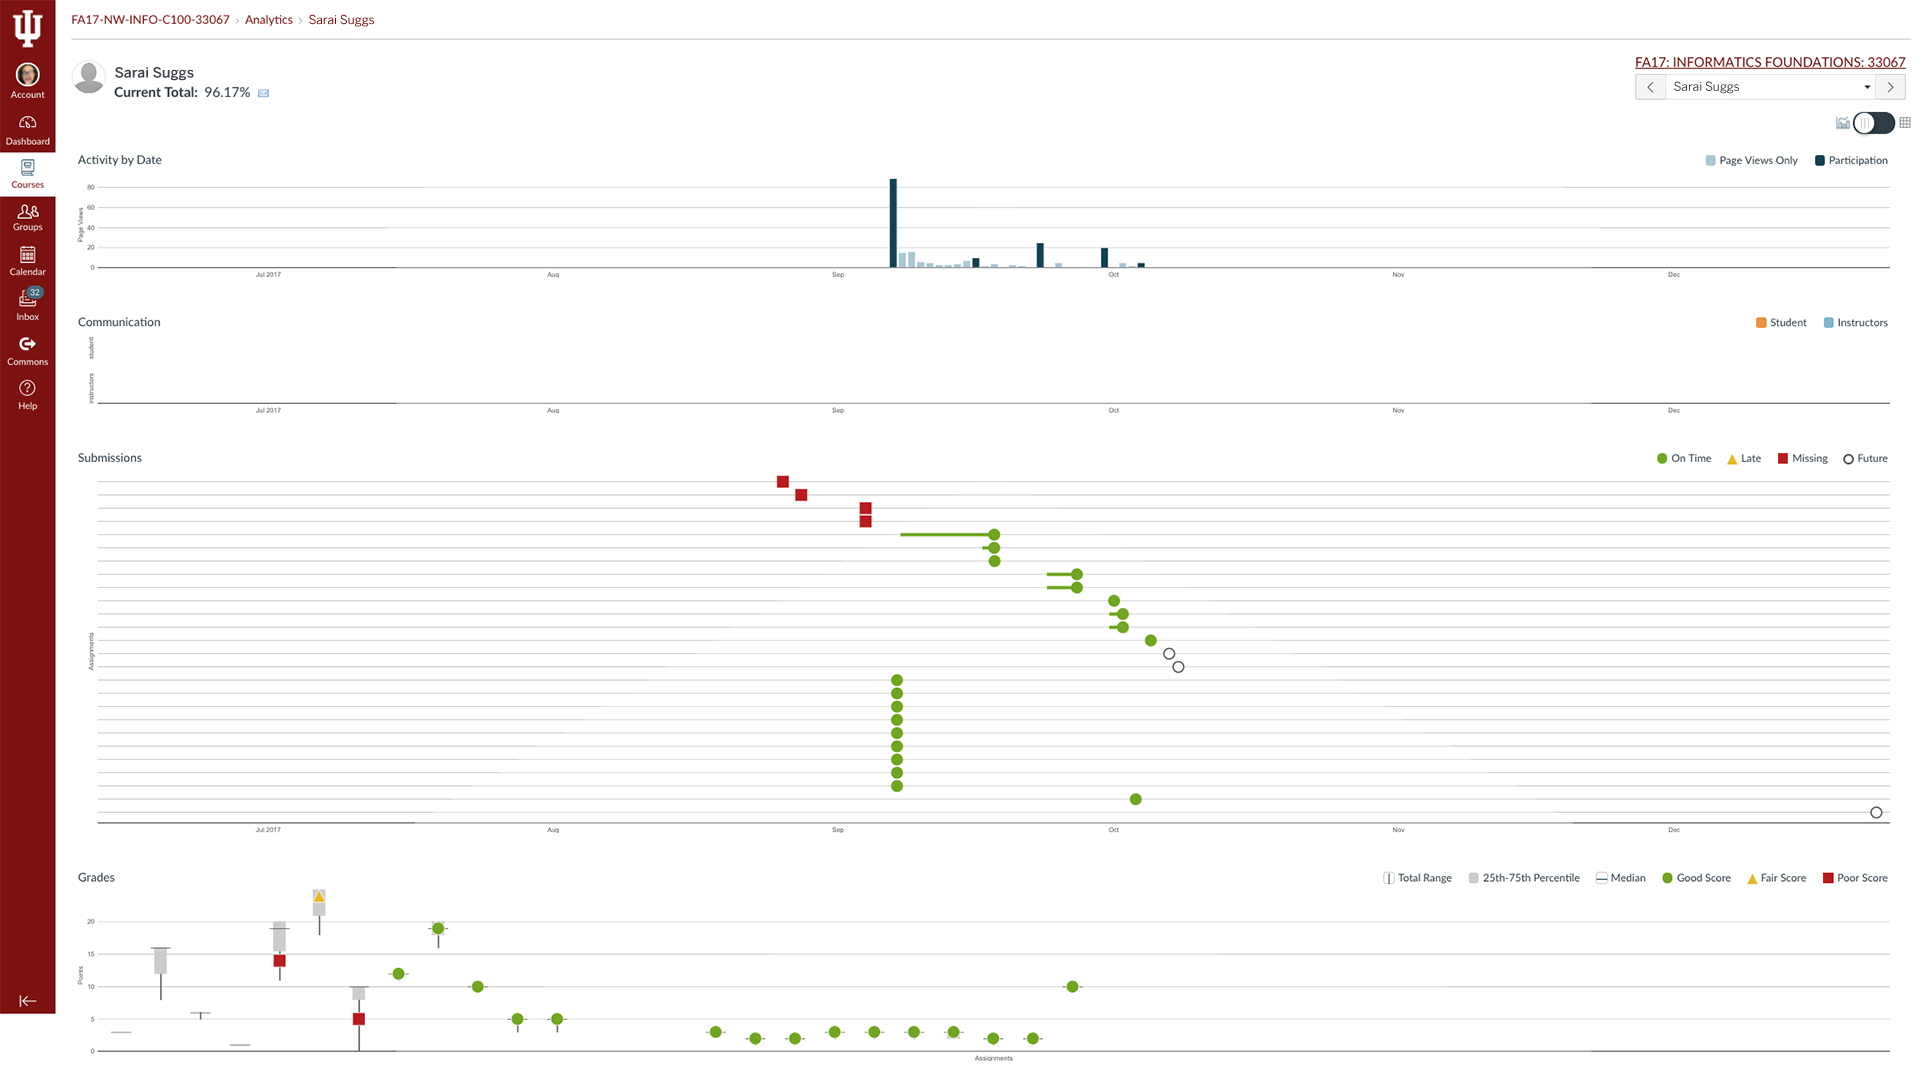
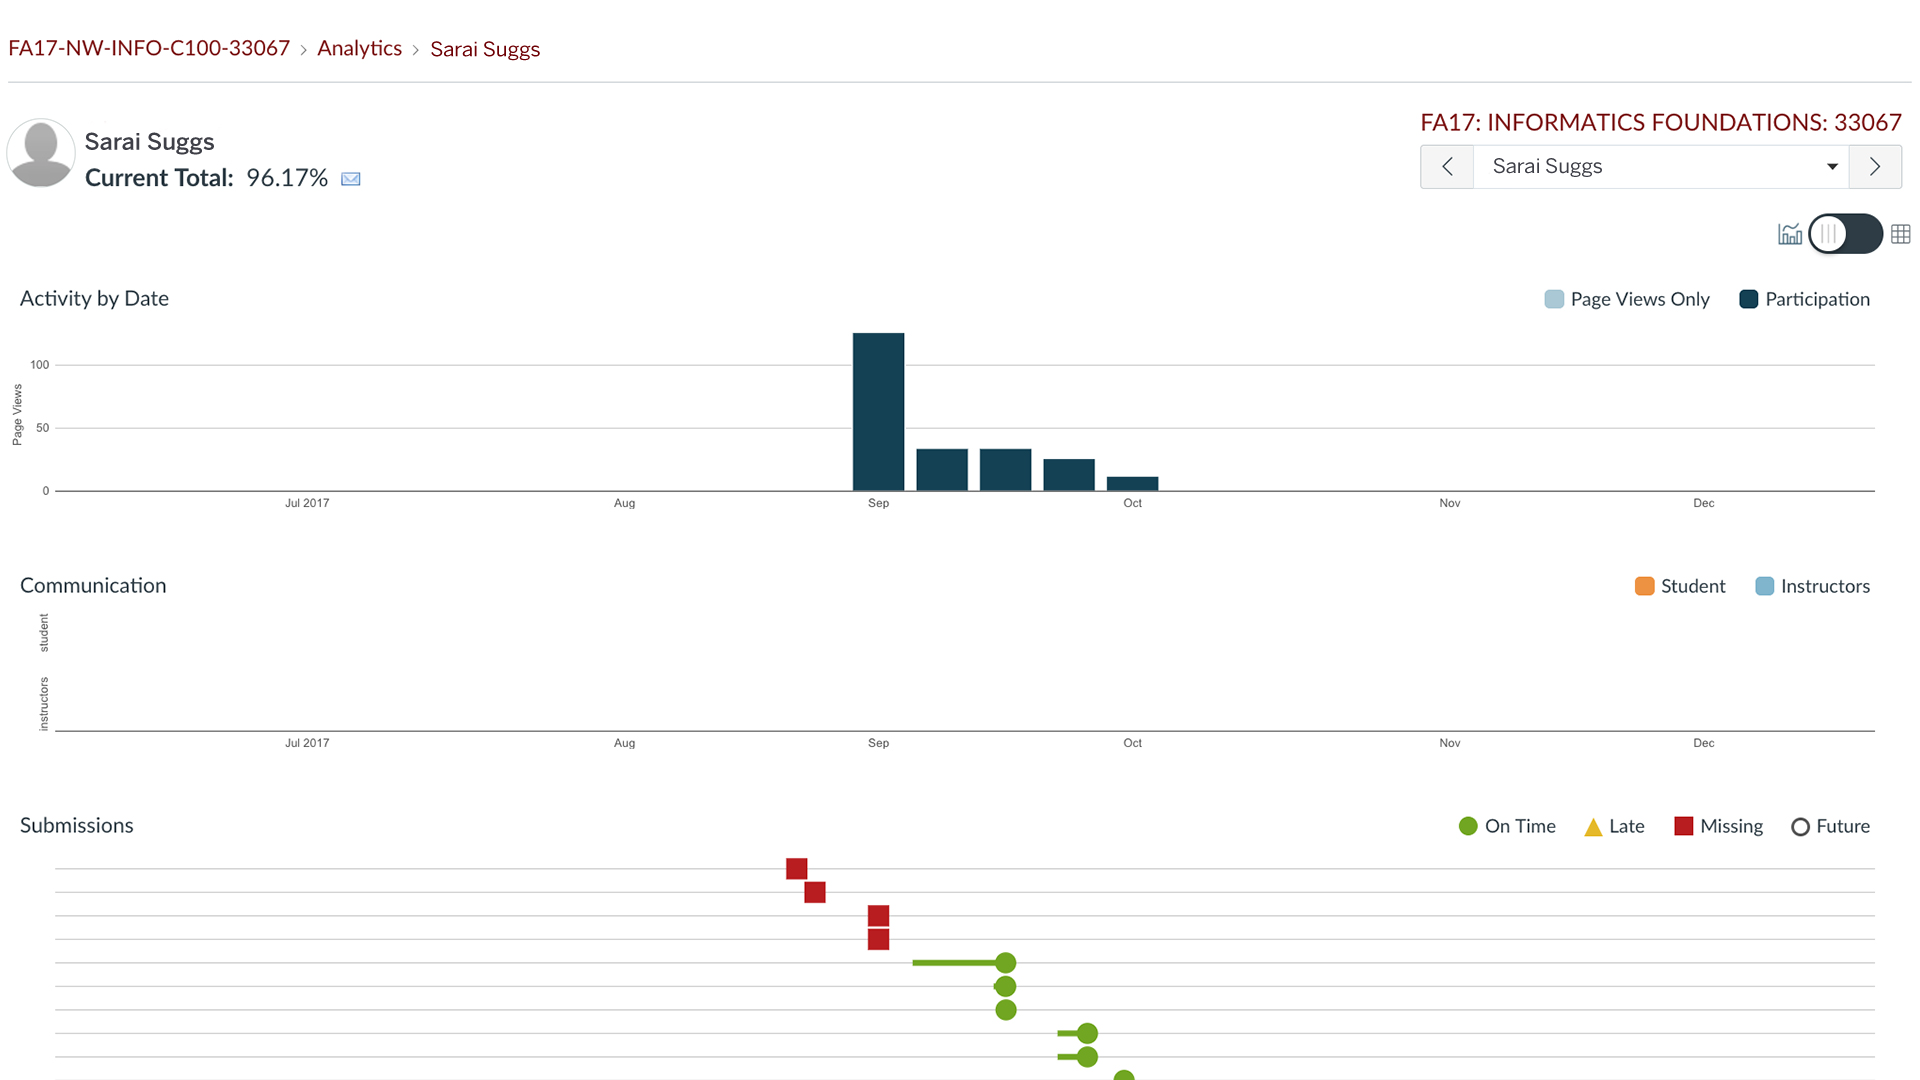
Canvas Course Analytics aggregates and presents activity, assignment submission, grade, and participation data for each student, represented in colorful visualizations to help instructors see at a glance which students are performing well and which are at risk.
Key Features for Teaching and Learning
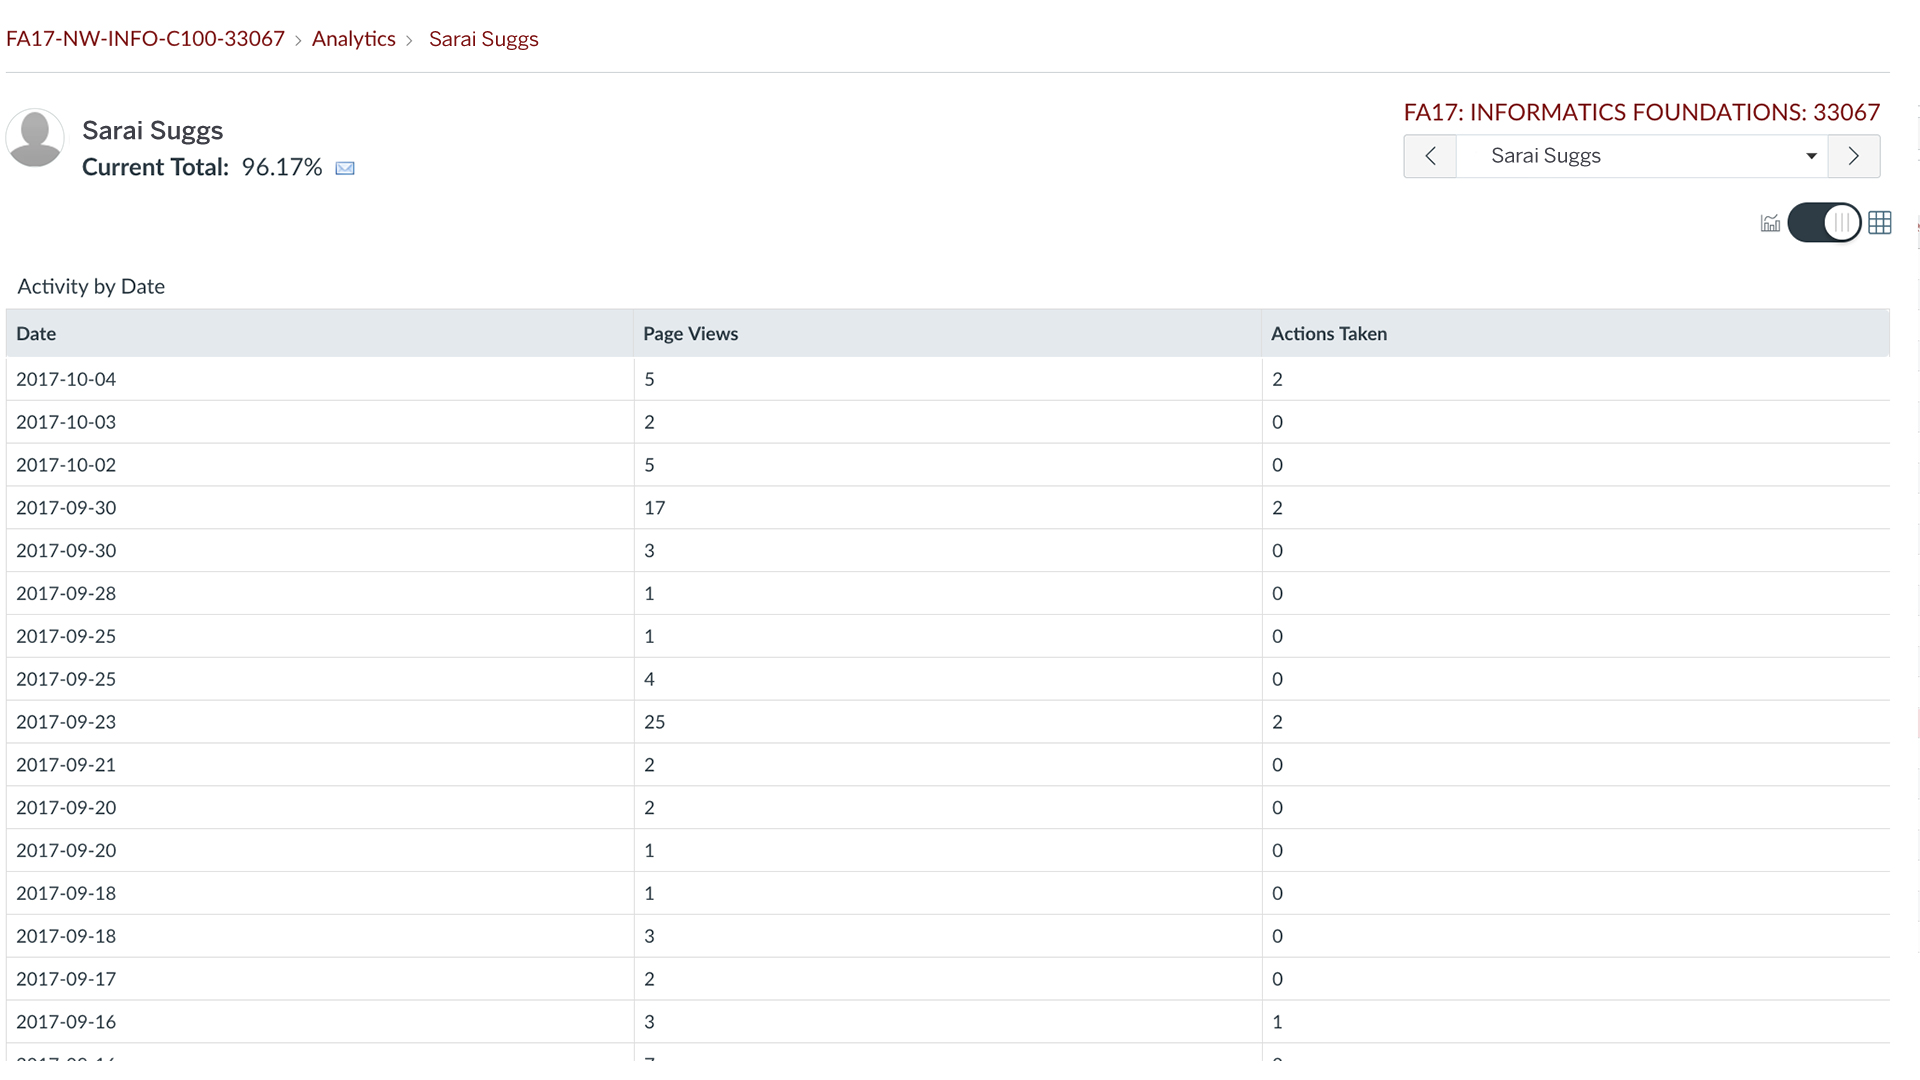
- See when students are active. "Activity" allows you to see when students view a page or participate in the course.
- Identify struggling students. "Submissions" allows you to view if students submit assignments on-time, late, or not at all.
- See grades at a glance. "Grades" uses a box and whisker plot to show the distribution of grades in the course.
- See individual student data. "Student Analytics" shows page view, participations, assignments, and current score for every student in the course.
Teaching Stories using this Tool
Keywords
Categories
Availability
- This tool is available for Faculty
- This tool is available for Staff
- This tool is not available for Students
- This tool is not available for Guests
- Available university-wide, across all campuses
Cost
No additional cost
Privacy, accessibility, and other information
- Canvas (Instructure) accessibility
- Canvas (Instructure) privacy policy
-
Integrated into Canvas.
Available in Navigation.