Images and Videos of Reports and Dashboards
About this Tool
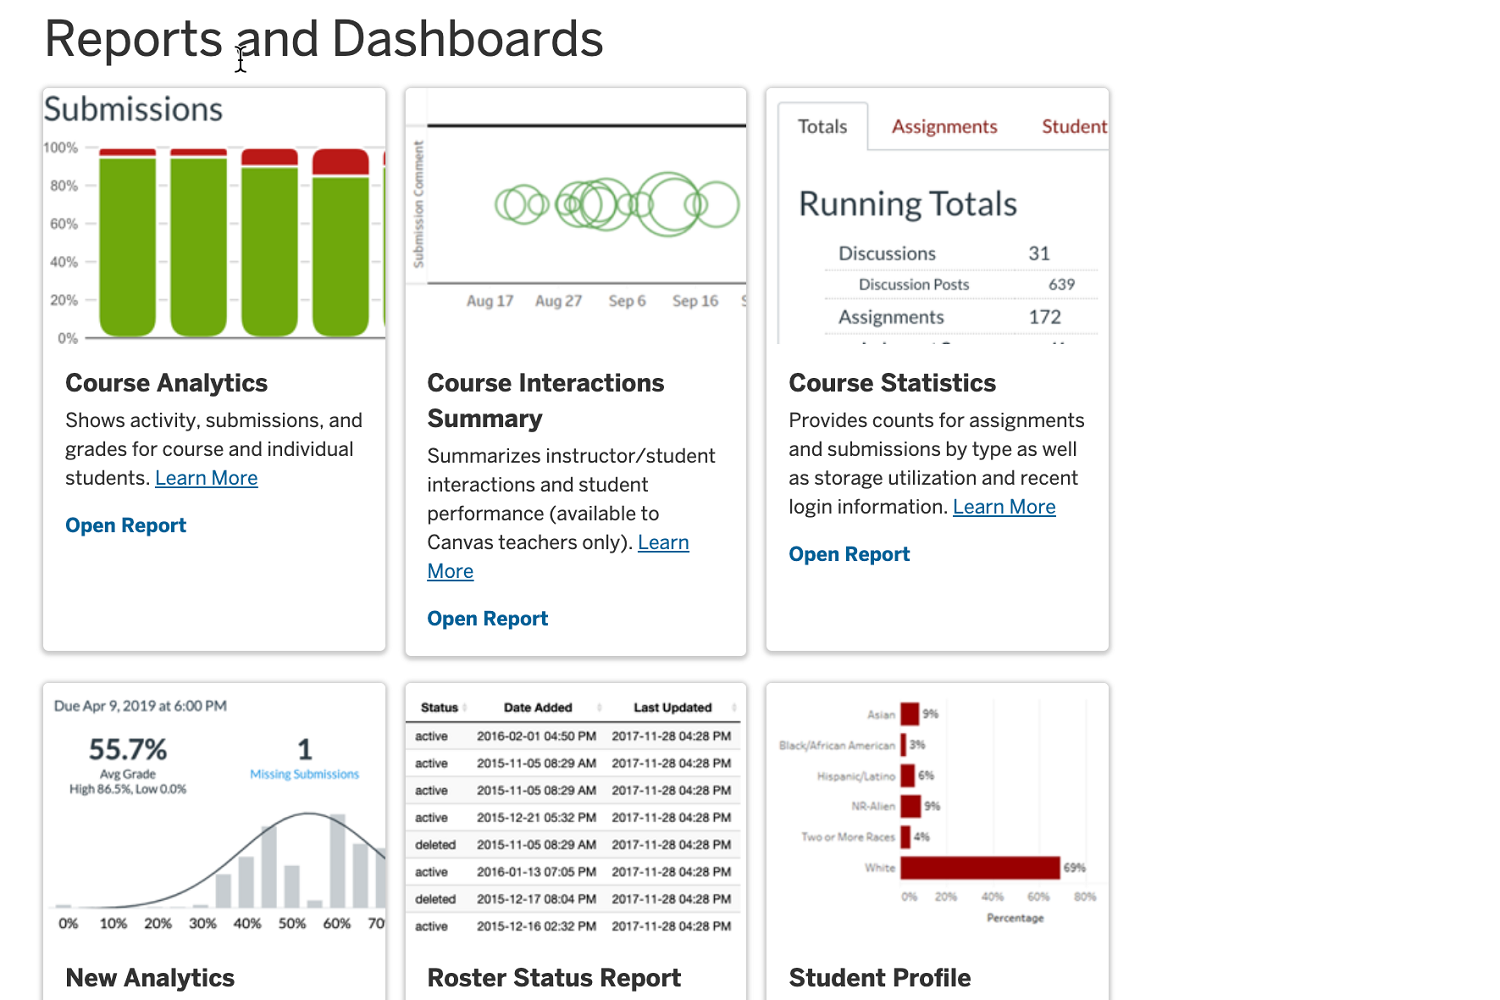
Reports and Dashboards, an external Canvas app developed at Indiana University, allows instructors to view and access all reports available for their Canvas course in one place. Currently, this tool is only available to Teachers, TAs, Designers, and related roles. Each user's course role determines which reports are visible in the tool. Additionally, some reports are only visible in credit-bearing courses, and access may be further restricted to faculty of record.
Key Features for Teaching and Learning
- Receive report names and descriptions. A name and description is provided for each report in the Reports and Dashboards tool.
- Learn more about a particular report. Each entry includes a link to a Knowledge Base (KB) document that describes the report in greater detail and explains how to use it.
- Launch a report. The "Open Report" link in each entry takes you directly to the selected report.
Teaching Stories using this Tool
Keywords
Categories
Availability
- This tool is available for Faculty
- This tool is available for Staff
- This tool is not available for Students
- This tool is not available for Guests
- Available university-wide, across all campuses
Cost
No additional cost
Privacy, accessibility, and other information
-
Integrated into Canvas.
Available in Navigation.


